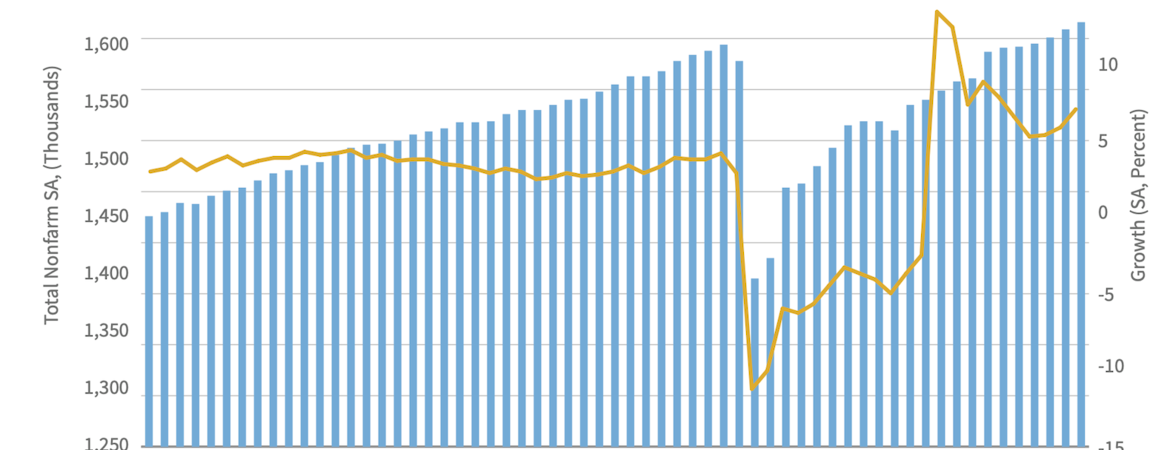
The Inland Empire’s labor market has now surpassed its pre-pandemic peak, having added back all the jobs it lost due to the COVID-19 crisis – and more, according to an analysis released today by the UC Riverside School of Business Center for Economic Forecasting and Development. Additionally, in a significant adjustment, the annual benchmark revision released by the state’s Economic Development Department, or EDD, shows that instead of an overall loss, the region has increased its total payroll employment since the pandemic first upended labor markets around the globe.
Since hitting bottom in April 2020, the Inland Empire’s labor market has expanded by 151,200 jobs and is now 1.4% (or 22,500 jobs) above its peak from February 2020, right before pandemic-driven public health mandates were implemented. Total employment in the region has jumped by 0.9% since February 2020 rather than declining by -2.2% as originally estimated by the EDD.
“The Inland Empire has now reached the point where we can talk about job growth as opposed to recovery,” said Taner Osman, research manager at the Center for Economic Forecasting and one of the report’s authors. “California as a whole has recovered 92% of the jobs it lost and with relatively high vaccination rates and falling hospitalizations, the job expansion at both the state and regional level should continue in 2022.”
Key Findings:
- Inflation Overpowers Wage Growth: Wages grew by 2.3% in the Inland Empire from the 3rd quarter of 2020 to the 3rd quarter of 2021 (the latest data available), a more modest growth rate than in the previous period. Local wage growth was strongest in Riverside County (3%) followed by San Bernardino County (1.7%), although these increases mark a decrease in real wages due to today’s historic inflation.
- Red Hot Consumer Demand: Consumer spending in the Inland Empire has continued to surge, with taxable receipts expanding by 22.8% from the 3rd quarter of 2020 to the 3rd quarter of 2021 (the latest data available). This trend mirrors consumer activity across the nation and is being driven in part by the unprecedented stimulus the Federal government threw into the economy at the onset of the pandemic.
- Fuel Spending Soars: Taxable receipts at Fuel and Service Stations in the Inland Empire increased by 56.9% over the last year, and as gas prices have hit record levels in the first part of 2022, spending in this category is almost certain to continue spiraling upwards over the near-term future.
- Historic Housing Market: Against a backdrop of historically low inventory, asking home prices in the Inland Empire ballooned by 18.3% from the 4th quarter of 2020 to the 4th quarter of 2021 (the latest data available) and ended the period with a median single-family home price of $517,000. Despite the increase, relative to the rest of Southern California, the region continues to be a haven of affordability: Median home prices in Los Angeles, Orange County, and San Diego currently stand at $860,000, $1.07 million, and $832,000, respectively.
- Apartment Mania: Demand for apartments has also surged in the Inland Empire over the last year with asking rents expanding by 17.4% to reach an average of $1,729 per month per unit. But, again, even with the increase, rent in the region is significantly more affordable than in Los Angeles ($2,136), Orange ($2,327), and San Diego ($2,155) Counties.
- Warehouse Space Heats Up… More: In the last edition of this report, the vacancy rate among warehouse properties in the Inland Empire was a low 5%. As of the 4th quarter of 2021 (the latest data available), the vacancy rate had fallen to 3.6% and this is despite 4.4 million square feet of new space coming online. Elevated consumer spending in E-Commerce is the primary driver of high warehouse demand.
The new Inland Empire Regional Intelligence Report was authored by Osman and Senior Research Associate Brian Vanderplas. The analysis examines how the Inland Empire’s labor market, real estate markets, and other areas of the economy are recovering from the COVID-19 pandemic and their outlook for the remainder of the year. View the full analysis here.


